|
LABOUR MARKET
--> Wallonia
Unemployment trends
Rate of registered job seekers not in employment
Employees
--> Province of Luxembourg
Unemployment trends
Employees
Wallonia
Unemployment trends on Wallonia
The breakdown for registered job seekers not in employment (DEII) on 31 december 2002 was :
|
Completely unemployed job seekers receiving unemployment benefit (CCI-DE)
|
186 306
|
|
Young workers waiting for unemployment benefit
|
22 333
|
|
Self-employed job seekers not in employment (DELI)
|
10 643
|
|
Other
|
16 022
|
|
Total
|
235 304
|
Various categories of "under-employed" people must be added (FOREM figures for December 2002), including,
- 58 433 CCI (not considered as job seekers for reasons of age);
- 31 254 persons benefiting from early retirement arrangements;
- 24 807 career breaks;
- 5 046 exemptions for family reasons or resumption of full-time study.
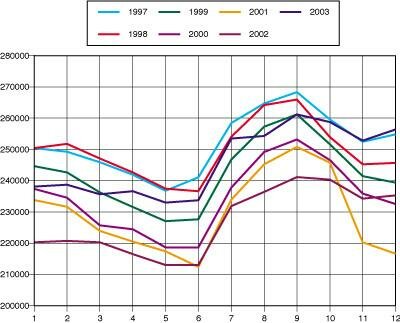
Registered job seekers not in employment
|
|
1997
|
1998
|
1999
|
2000
|
2001
|
2002
|
2003
|
|
January
|
250 434
|
250 481
|
244 674
|
237 361
|
233 794
|
220 316
|
238 127
|
|
February
|
249 237
|
251 786
|
242 684
|
234 549
|
231 636
|
220 726
|
238 726
|
|
March
|
245 920
|
247 138
|
236 266
|
225 712
|
223 915
|
220 286
|
235 694
|
|
April
|
241 941
|
242 650
|
231 560
|
224 479
|
220 500
|
216 507
|
236 660
|
|
May
|
236 812
|
237 443
|
227 065
|
218 679
|
217 398
|
213 020
|
232 986
|
|
June
|
241 065
|
236 612
|
227 675
|
218 679
|
212 415
|
213 001
|
233 705
|
|
July
|
258 447
|
254 109
|
246 821
|
237 856
|
233 982
|
231 854
|
253 525
|
|
August
|
264 721
|
264 189
|
257 300
|
249 197
|
245 217
|
236 386
|
254 303
|
|
September
|
268 323
|
265 942
|
261 253
|
253 222
|
250 853
|
241 168
|
261 224
|
|
October
|
259 586
|
253 943
|
251 654
|
246 621
|
245 775
|
230 326
|
258 778
|
|
November
|
252 464
|
245 279
|
241 434
|
235 911
|
220 309
|
234 294
|
252 791
|
|
December
|
254 847
|
245 683
|
239 372
|
232 530
|
216 689
|
235 3042
|
256 389
|
TOP
Rate of registered job seekers not in employment - December 2002
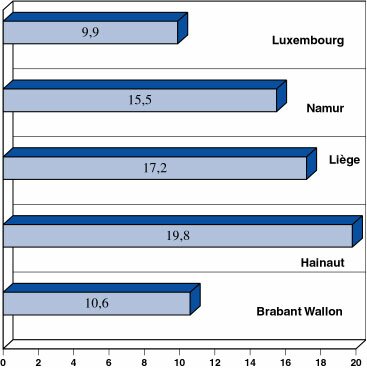
Rate DEI : Number of registered job seekers not in employment, expressed as a percentage of the active population.
DEI : Job seekers not in employment: includes the completely unemployed job seekers receiving unemployment benefit, young people waiting to receive benefits, self-employed job seekers not in employment.
Completely unemployed receiving unemployment benefit not considered as be job seekers for reasons of age or health are not included
TOP
Employees
|
Provinces
|
1975
|
1980
|
1985
|
1990
|
1995
|
1998
|
1999
|
2000
|
2001
|
|
30.June
|
X 1000
|
|
Hainaut
|
345
|
330
|
292
|
310
|
307
|
312
|
315
|
322
|
326
|
|
Liège
|
307
|
299
|
271
|
279
|
274
|
286
|
286
|
288
|
294
|
|
Luxembourg
|
42
|
48
|
46
|
55
|
61
|
63
|
64
|
65
|
67
|
|
Namur
|
92
|
99
|
90
|
101
|
105
|
109
|
112
|
116
|
117
|
|
Brabant Wallon
|
62
|
65
|
63
|
73
|
81
|
85
|
89
|
93
|
96
|
|
Wallonia
|
848
|
840
|
762
|
818
|
828
|
855
|
866
|
884
|
899
|
|
Belgium
|
2 977
|
2 989
|
2 843
|
3 144
|
3 187
|
3 308
|
3 356
|
3 412
|
3 487
|
Source : ONSS
TOP
Province of Luxembourg
Unemployment trends
Not included : Job seekers not in employment: includes the completely unemployed job seekers receiving unemployment benefit, young people waiting to receive benefits, self-employed job seekers not in employment.
|
Registered job seekers not in employment
|
|
Year/month
|
Total DEII
|
CCI-DE
|
Young people
|
DELI
|
Other
|
|
97/06
|
9 468
|
7 952
|
407
|
596
|
513
|
|
98/06
|
9 181
|
7 772
|
536
|
403
|
470
|
|
99/06
|
9 068
|
7 482
|
446
|
602
|
538
|
|
00/06
|
8 516
|
7 138
|
429
|
476
|
473
|
|
01/06
|
8 831
|
7 286
|
535
|
589
|
421
|
|
Détails for June 2002
|
|
Arrondissements
|
Total DEII
|
CCI-DE
|
Young people
|
DELI
|
Other
|
|
Arlon
|
1 461
|
1 134
|
92
|
126
|
109
|
|
Bastogne
|
1 486
|
1 197
|
88
|
121
|
80
|
|
Marche
|
2 267
|
1 944
|
129
|
119
|
75
|
|
Neufchâteau
|
2 080
|
1 758
|
120
|
109
|
93
|
|
Virton
|
1 537
|
1 253
|
106
|
114
|
64
|
|
Total
|
8 831
|
7 286
|
535
|
589
|
421
|
Sources : ONEM, FOREM
Employees
|
Arrondissements 30/06
|
1975
|
1980
|
1985
|
1990
|
1995
|
1997
|
1998
|
1999
|
2000
|
2001
|
|
Arlon
|
11 882
|
12 676
|
12 347
|
14 425
|
16 585
|
17 578
|
18 142
|
18 340
|
18 135
|
18 138
|
|
Bastogne
|
5 528
|
6 480
|
6 279
|
7 992
|
8 981
|
8 791
|
8 991
|
8 871
|
9 248
|
9 422
|
|
Marche
|
7 719
|
9 821
|
9 614
|
11 274
|
12 732
|
13 426
|
13 343
|
13 248
|
13 891
|
14 356
|
|
Neufchâteau
|
10 842
|
10 938
|
10 591
|
12 618
|
13 590
|
13 741
|
14 302
|
14 490
|
15 090
|
15 424
|
|
Virton
|
6 266
|
7 622
|
7 331
|
8 704
|
8 827
|
8 593
|
8 618
|
8 673
|
8 725
|
9 193
|
|
Total
|
42 237
|
47 537
|
46 162
|
55 013
|
60 715
|
62 129
|
63 396
|
63 622
|
65 089
|
66 533
|
Source : ONSS
Top
|